
ClickStack February '26: API, Embedded UI & Raw SQL

Alps Wang
Mar 13, 2026 · 1 views
Evolving Observability with ClickStack
The February 2026 ClickStack update marks a substantial leap forward, particularly for enterprises and developers aiming for robust, automated observability. The introduction of an external API for ClickHouse Cloud is a game-changer, enabling true 'configuration as code' workflows. This integration with CI/CD pipelines and the ability to manage dashboards, alerts, and webhooks programmatically will significantly streamline deployment and management for large-scale operations. The embedding of the ClickStack UI directly within the ClickHouse binary is another brilliant move, drastically lowering the barrier to entry for local development, experimentation, and even self-inspection of ClickHouse's internal workings. This makes ClickHouse an even more attractive platform for developers who want to understand performance and diagnose issues directly from the source. The expansion of visualization capabilities, especially the introduction of raw SQL tables, directly addresses a critical user need for greater flexibility and power beyond guided builders. This allows seasoned users to leverage the full expressiveness of ClickHouse's SQL engine for complex analytical patterns, joins, and correlations across datasets, pushing the boundaries of what can be visualized. The Metric Attribute Explorer's enhancement for OpenTelemetry metrics is also a welcome improvement, simplifying metric discovery and reducing trial-and-error for users. Pie charts, while sometimes debated, are a practical addition for proportional breakdowns, further broadening the visualization toolkit.
However, the article hints at future plans for broader SQL exposure in other visualizations and continued Terraform support, suggesting that the current implementation of raw SQL in tables is a foundational step. While the performance optimizations for Top-N queries are impressive, the selective enablement of use_top_k_dynamic_filtering due to compatibility issues with functions like rand() indicates that there are still nuances to be ironed out for full, universal application. The article could benefit from a deeper dive into the specific compatibility challenges and the roadmap for overcoming them. Furthermore, while the embedded UI is great for local use, clear guidelines on its limitations for production scenarios are implicitly understood but could be explicitly stated. The focus on OpenTelemetry metrics and traces is commendable, but an explicit mention of support for other common observability protocols or data sources, if any, would provide a more complete picture of ClickStack's ecosystem integration.
Key Points
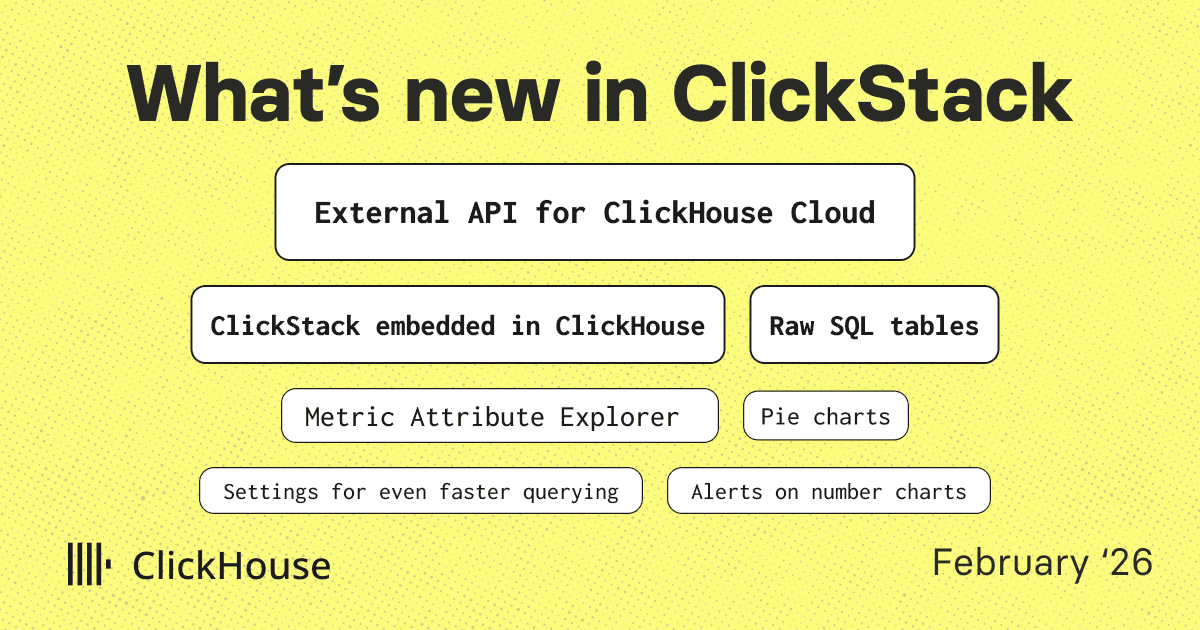
- ClickHouse Cloud now offers an external API for managing observability resources (dashboards, alerts, webhooks) programmatically, enabling 'configuration as code' and CI/CD integration.
- The ClickStack UI is now embedded directly within the ClickHouse binary (version 26.2), simplifying local development, learning, and experimentation.
- Raw SQL tables are introduced, allowing users to write native SQL queries for visualizations, offering full control and the ability to perform complex operations like joins and correlations across datasets.
- Enhancements to the Metric Attribute Explorer simplify the discovery and use of labels for OpenTelemetry metrics.
- Pie charts are now available as a new visualization type, suitable for proportional breakdowns across traces, logs, and OpenTelemetry metrics.
- Significant performance optimizations for Top-N queries are enabled by default, leveraging skip-index-driven filtering for up to 2x-3x improvements in log search and ranking scenarios.
- Further performance optimizations for skip indices are being leveraged, with ongoing work to enhance their application.
📖 Source: What's new in ClickStack. February '26.
Related Articles
Comments (0)
No comments yet. Be the first to comment!