
Postgres Wait Events Now In ClickHouse Insights

Alps Wang
Oct 19, 2026 · 1 views
Unlocking Postgres Performance Secrets
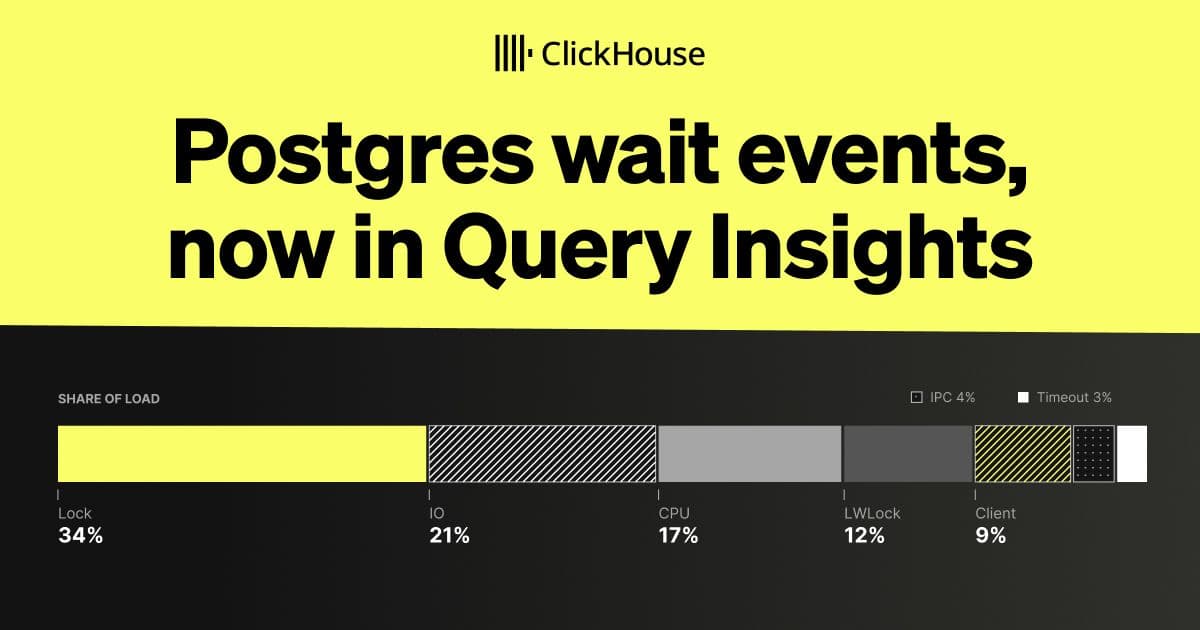
The ClickHouse Blog post announces the integration of PostgreSQL wait event metrics into their Query Insights feature for ClickHouse Managed Postgres. This is a valuable addition for database administrators and developers, as wait events provide granular visibility into the root causes of query performance issues beyond just CPU, reads, and writes. The ability to see breakdowns by wait_event_type, such as IO, Lock, and Timeout, and then drill down into specific wait_event values like tuple, transactionid, and relation locks, empowers users to pinpoint bottlenecks more effectively. The inclusion of metrics like blocked sessions and lock wait times further enhances the diagnosis of lock contention, a common performance killer in concurrent database environments.
The integration with Prometheus is another strong point, allowing for custom dashboards and alerting, which is crucial for proactive monitoring and incident response in production systems. This moves beyond reactive query analysis to enable a more robust observability strategy. The mention of ClickHouse Agents and their ability to interpret these wait events alongside other metrics suggests a move towards more intelligent, AI-assisted database troubleshooting, which is a forward-looking aspect. However, a potential limitation or concern could be the clarity and completeness of the wait event categorization and the depth of historical data retention within Query Insights. While the article points to PostgreSQL documentation for definitions, a brief primer within the blog post itself for the most common or impactful wait events would be beneficial for users less familiar with PostgreSQL internals. Furthermore, the effectiveness of the ClickHouse Agents in truly simplifying complex wait event analysis will depend on their underlying AI models and how well they can correlate wait events with application behavior.
Overall, this update democratizes access to advanced PostgreSQL diagnostics within a managed service context. It benefits a wide range of users, from junior developers trying to understand why a query is slow to seasoned DBAs optimizing complex workloads. The innovation lies in bringing these detailed wait event metrics, typically requiring manual configuration or specialized tooling, directly into a user-friendly managed service interface and making them actionable through advanced features like AI-assisted investigation. The comparison to existing solutions would be with native PostgreSQL tools like pg_stat_activity or external monitoring solutions, but ClickHouse aims to provide a more integrated and simplified experience.
Key Points
- ClickHouse Managed Postgres now includes wait event metrics in Query Insights.
- Users can see active sessions split by wait_event_type (e.g., IO, Lock, CPU) and drill down into specific wait_event values.
- Metrics like blocked sessions and lock wait times are available to diagnose lock contention.
- Wait events are also accessible via Prometheus for custom dashboards and alerting.
- ClickHouse Agents can assist in debugging wait events alongside other metrics.
Related Articles
Comments (0)
No comments yet. Be the first to comment!