
Postgres Performance Unlocked: ClickHouse Cloud's New Insights

Alps Wang
May 8, 2026 · 1 views
Deep Dive into Postgres Query Insights
ClickHouse Cloud's introduction of Postgres Query Insights, powered by the open-source pg_stat_ch extension, represents a compelling advancement in database performance monitoring. The tiered approach—Overview, Slow Patterns, and Detail—is thoughtfully designed to guide users from a high-level health check to granular diagnostics. The innovation lies in leveraging ClickHouse's analytical prowess to process and present detailed per-statement telemetry from PostgreSQL, enabling rapid identification of performance bottlenecks. The explicit focus on denormalizing query literals to protect PII/PHI is a critical design choice that fosters trust and wider adoption. Furthermore, the integration of AI-ready capabilities via an upcoming Open API signals a forward-looking strategy, positioning this feature not just for immediate diagnostic needs but for future automation.
However, a primary concern revolves around the dependency on ClickHouse Cloud for the managed PostgreSQL offering. While this integration is the core innovation, it ties users to ClickHouse's ecosystem for advanced insights. For organizations already heavily invested in other cloud providers or preferring self-hosted PostgreSQL with custom monitoring, the immediate benefit might be limited. The article also highlights the pg_stat_ch extension's overhead, though stated as ~3%, could still be a factor for extremely high-throughput or resource-constrained environments. The preview status means that certain features, like wait events and EXPLAIN plan exposure, are still on the roadmap, suggesting that the initial release, while powerful, is not yet fully comprehensive. Nevertheless, the ability to pinpoint issues like sort spills and parallelism inefficiencies with such clarity is a significant step forward for PostgreSQL performance tuning.
Key Points
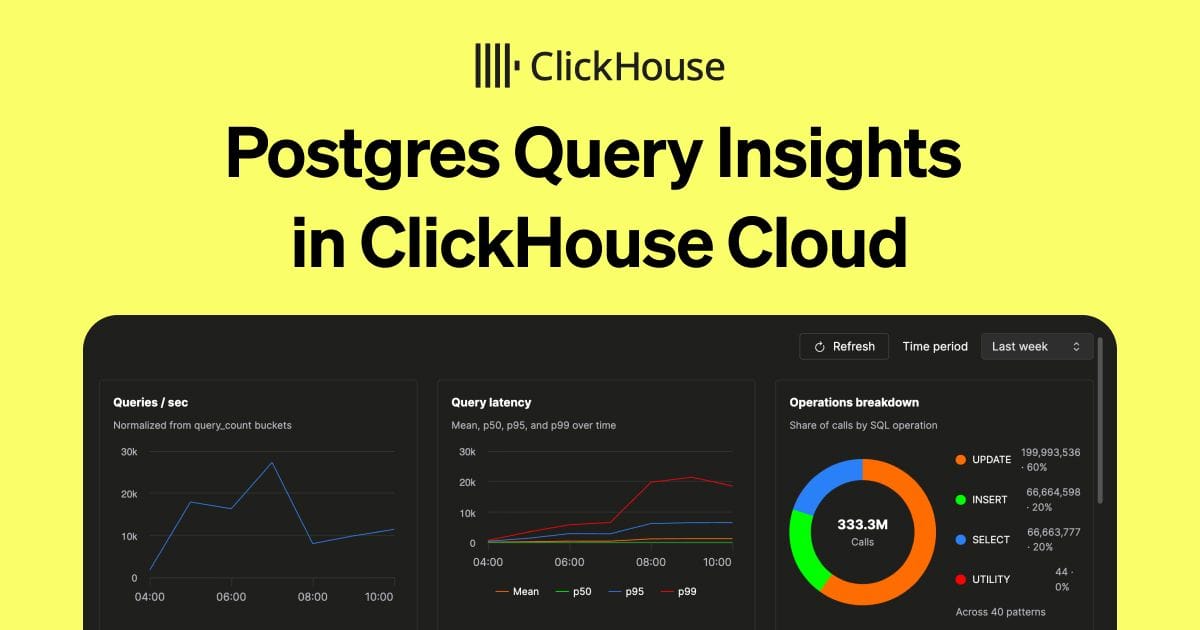
- ClickHouse Cloud introduces "Postgres Query Insights" for managed PostgreSQL services, offering detailed per-statement telemetry.
- The feature leverages the open-source
pg_stat_chextension to stream data into ClickHouse for analysis. - It provides a three-tiered diagnostic approach: Overview (database health), Slow Patterns (ranked by impact), and Detail (granular diagnostic data).
- Key diagnostic metrics include query volume, error rate, cache hit ratio, latency percentiles, CPU usage, temp spills, and parallelism issues.
- The system normalizes query literals to protect PII/PHI before data leaves the database.
- An upcoming Open API aims to enable AI agents for autonomous performance analysis and remediation.
- Future enhancements include wait events, EXPLAIN plan exposure, and actionable recommendations (index hints, work_mem tuning).
📖 Source: Introducing Postgres Query Insights in ClickHouse Cloud
Related Articles
Comments (0)
No comments yet. Be the first to comment!