
CloudWatch Embraces OpenTelemetry Metrics in Preview

Alps Wang
Apr 29, 2026 · 1 views
Unified Observability with OTEL
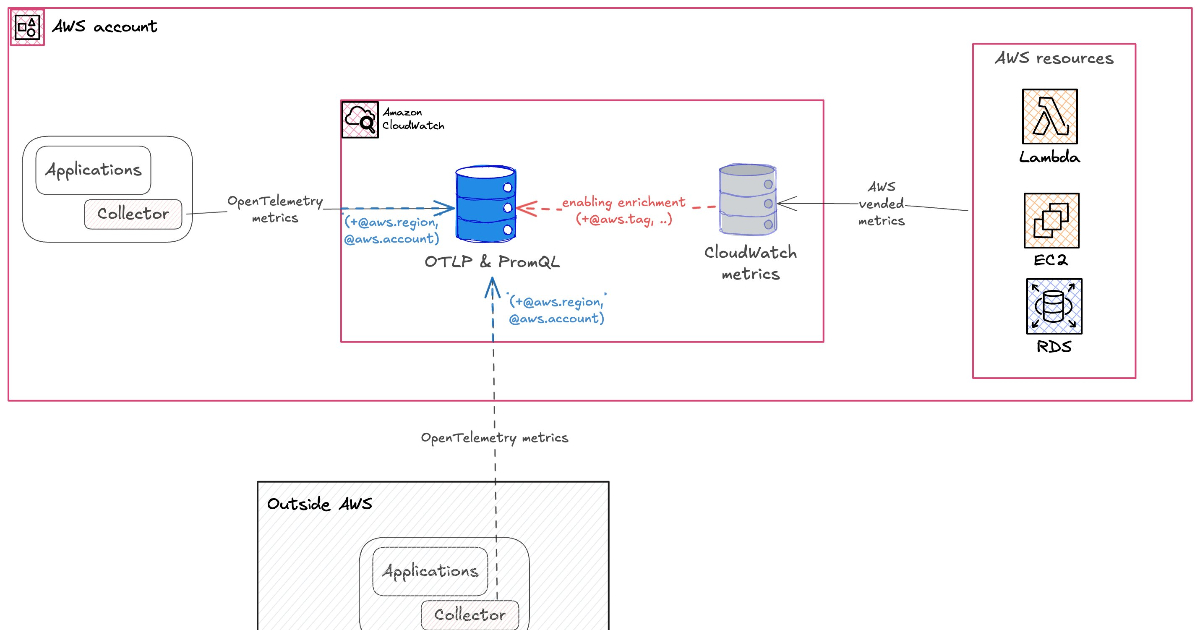
Amazon CloudWatch's introduction of OpenTelemetry (OTEL) metrics support in preview marks a pivotal step towards unifying observability pipelines within the AWS ecosystem. The ability to ingest OTEL metrics natively, alongside existing traces and logs, streamlines the developer experience significantly. This eliminates the need for complex conversion layers, allowing teams to leverage open standards across their entire telemetry data. The integration of PromQL for querying metrics directly within CloudWatch is another major win, enabling Prometheus users to transition seamlessly and reuse existing query logic and dashboards. The automatic enrichment of metrics with AWS resource metadata further enhances the value proposition, providing richer context without additional instrumentation, thus consolidating infrastructure, container, and application metrics into a single pane of glass. This move aligns CloudWatch with the broader industry trend towards open observability standards, making it a more attractive option for organizations prioritizing interoperability and avoiding vendor lock-in.
However, the preview status implies potential for future changes in functionality or pricing. The community's concern regarding the cost implications of high-cardinality metrics is particularly noteworthy. While the preview is free, the transition to general availability could introduce significant expenses for organizations that generate a vast number of unique metric dimensions. This necessitates careful capacity planning and cost management strategies. Furthermore, while OTEL support is comprehensive, the depth of integration and performance nuances for extremely large-scale deployments will only become fully apparent with broader adoption and long-term usage. The separate announcement of OTEL-based Container Insights for EKS further underscores AWS's commitment to this standard, but the full impact on existing Container Insights users and the migration path needs to be clearly communicated as these features mature.
Ultimately, this feature is a boon for developers and DevOps teams seeking a more standardized and integrated approach to observability. Organizations heavily invested in Prometheus, those adopting microservices architectures with high cardinality needs, and companies aiming to reduce their reliance on proprietary telemetry formats will benefit immensely. The ability to query all telemetry data using familiar tools and languages within CloudWatch simplifies operations and accelerates troubleshooting. The key takeaway is that AWS is actively embracing open standards, which is a positive development for the cloud-native ecosystem, provided that cost and performance are managed effectively post-preview.
Key Points
- Amazon CloudWatch now supports OpenTelemetry (OTEL) metrics in public preview.
- This allows direct ingestion of OTEL metrics into CloudWatch, alongside traces and logs, using a single protocol (OTLP).
- Features a high-cardinality metrics store supporting up to 150 labels per metric.
- Enables querying OTEL metrics using PromQL directly within the CloudWatch console.
- AWS automatically enriches ingested metrics with resource metadata (account ID, Region, cluster ARN, tags).
- Promises a unified view for infrastructure, container, and application metrics.
- Preview is free of charge and currently available in five regions.
- Community expresses excitement but also concerns about potential high costs with high-cardinality metrics.
📖 Source: Amazon CloudWatch Introduces OpenTelemetry Metrics Support in Preview
Related Articles
Comments (0)
No comments yet. Be the first to comment!