ClickStack: Trace, Metrics, and Dashboards Evolved

Alps Wang
Aug 11, 2026 · 1 views
Observability Reimagined
The June-July ClickStack update showcases a strong commitment to user-driven development, particularly in enhancing the trace analysis experience. The introduction of a minimap for navigating deep traces and stable service coloring in the waterfall are crucial improvements for debugging complex distributed systems. Furthermore, the experimental integration with external Prometheus-compatible endpoints is a significant step towards a more flexible and unified observability platform, allowing users to leverage existing infrastructure while exploring ClickHouse's capabilities. This feature, in particular, lowers the barrier to entry for migrating or augmenting Prometheus workloads, a common pain point for many organizations.
However, the experimental nature of the Prometheus integration requires careful consideration. While promising, users should be aware of potential changes and the recommendation to use it in non-production environments first. The performance implications of cascading dashboard filters, though mitigated by fetching narrowed values only when a dropdown is opened, could still be a concern for extremely high-cardinality data sources. Finally, while the focus on trace improvements is appreciated, continued investment in other observability pillars like logs and security event correlation would further solidify ClickStack's position as a comprehensive solution.
Key Points
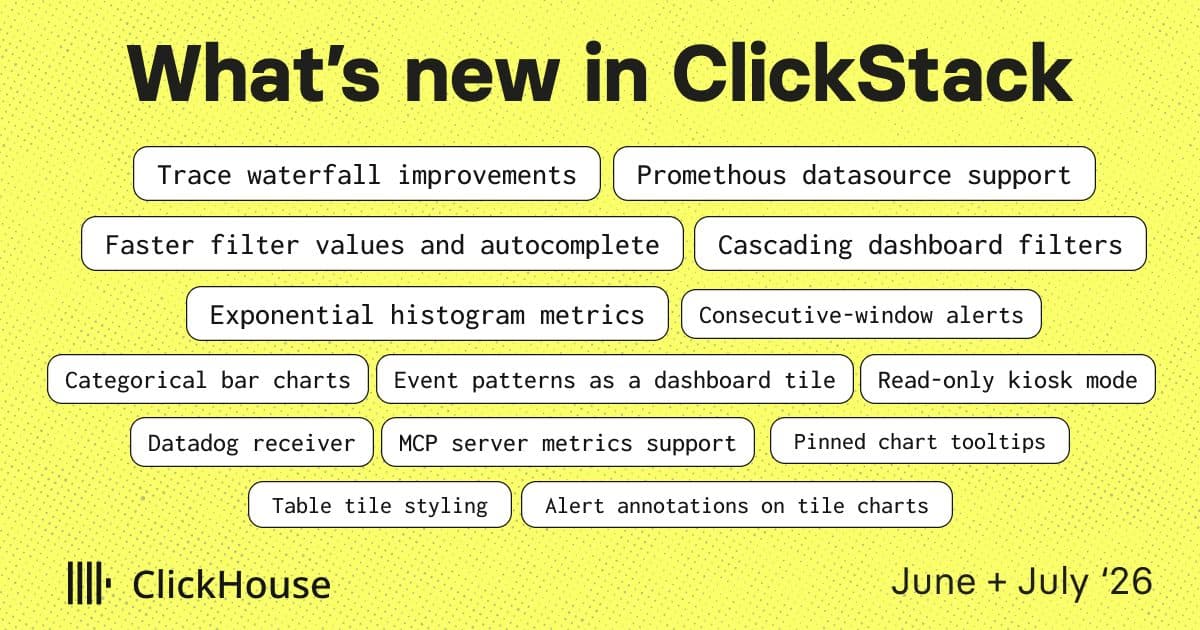
- Redesigned trace waterfall with stable service colors and improved span duration display.
- Introduction of a minimap for easier navigation of long traces.
- OpenTelemetry span links now displayed in the span detail panel for better cross-trace navigation.
- Experimental integration with external Prometheus-compatible endpoints for unified observability.
- Cascading dashboard filters enable faceted search-like narrowing of options.
- Faster filter value fetching using ClickHouse text indexes where available.
- Consecutive-window alerts filter out transient spikes by requiring conditions to hold across multiple time windows.
- Support for quantile and sum aggregations on exponential histogram metrics.
- New categorical bar chart type for easier ranked comparisons.
- Event patterns now available as a dashboard tile type.
- Read-only kiosk mode for dashboards on wall displays.
- External API v2 expanded to include CRUD operations for saved searches.
📖 Source: Whats new in ClickStack - June + July
Related Articles
Comments (0)
No comments yet. Be the first to comment!